




The App Store is crowded with apps that offer almost the same thing. The choice is usually made within seconds, from a name and a few screenshots, which is why paid placement gets you seen but not chosen.


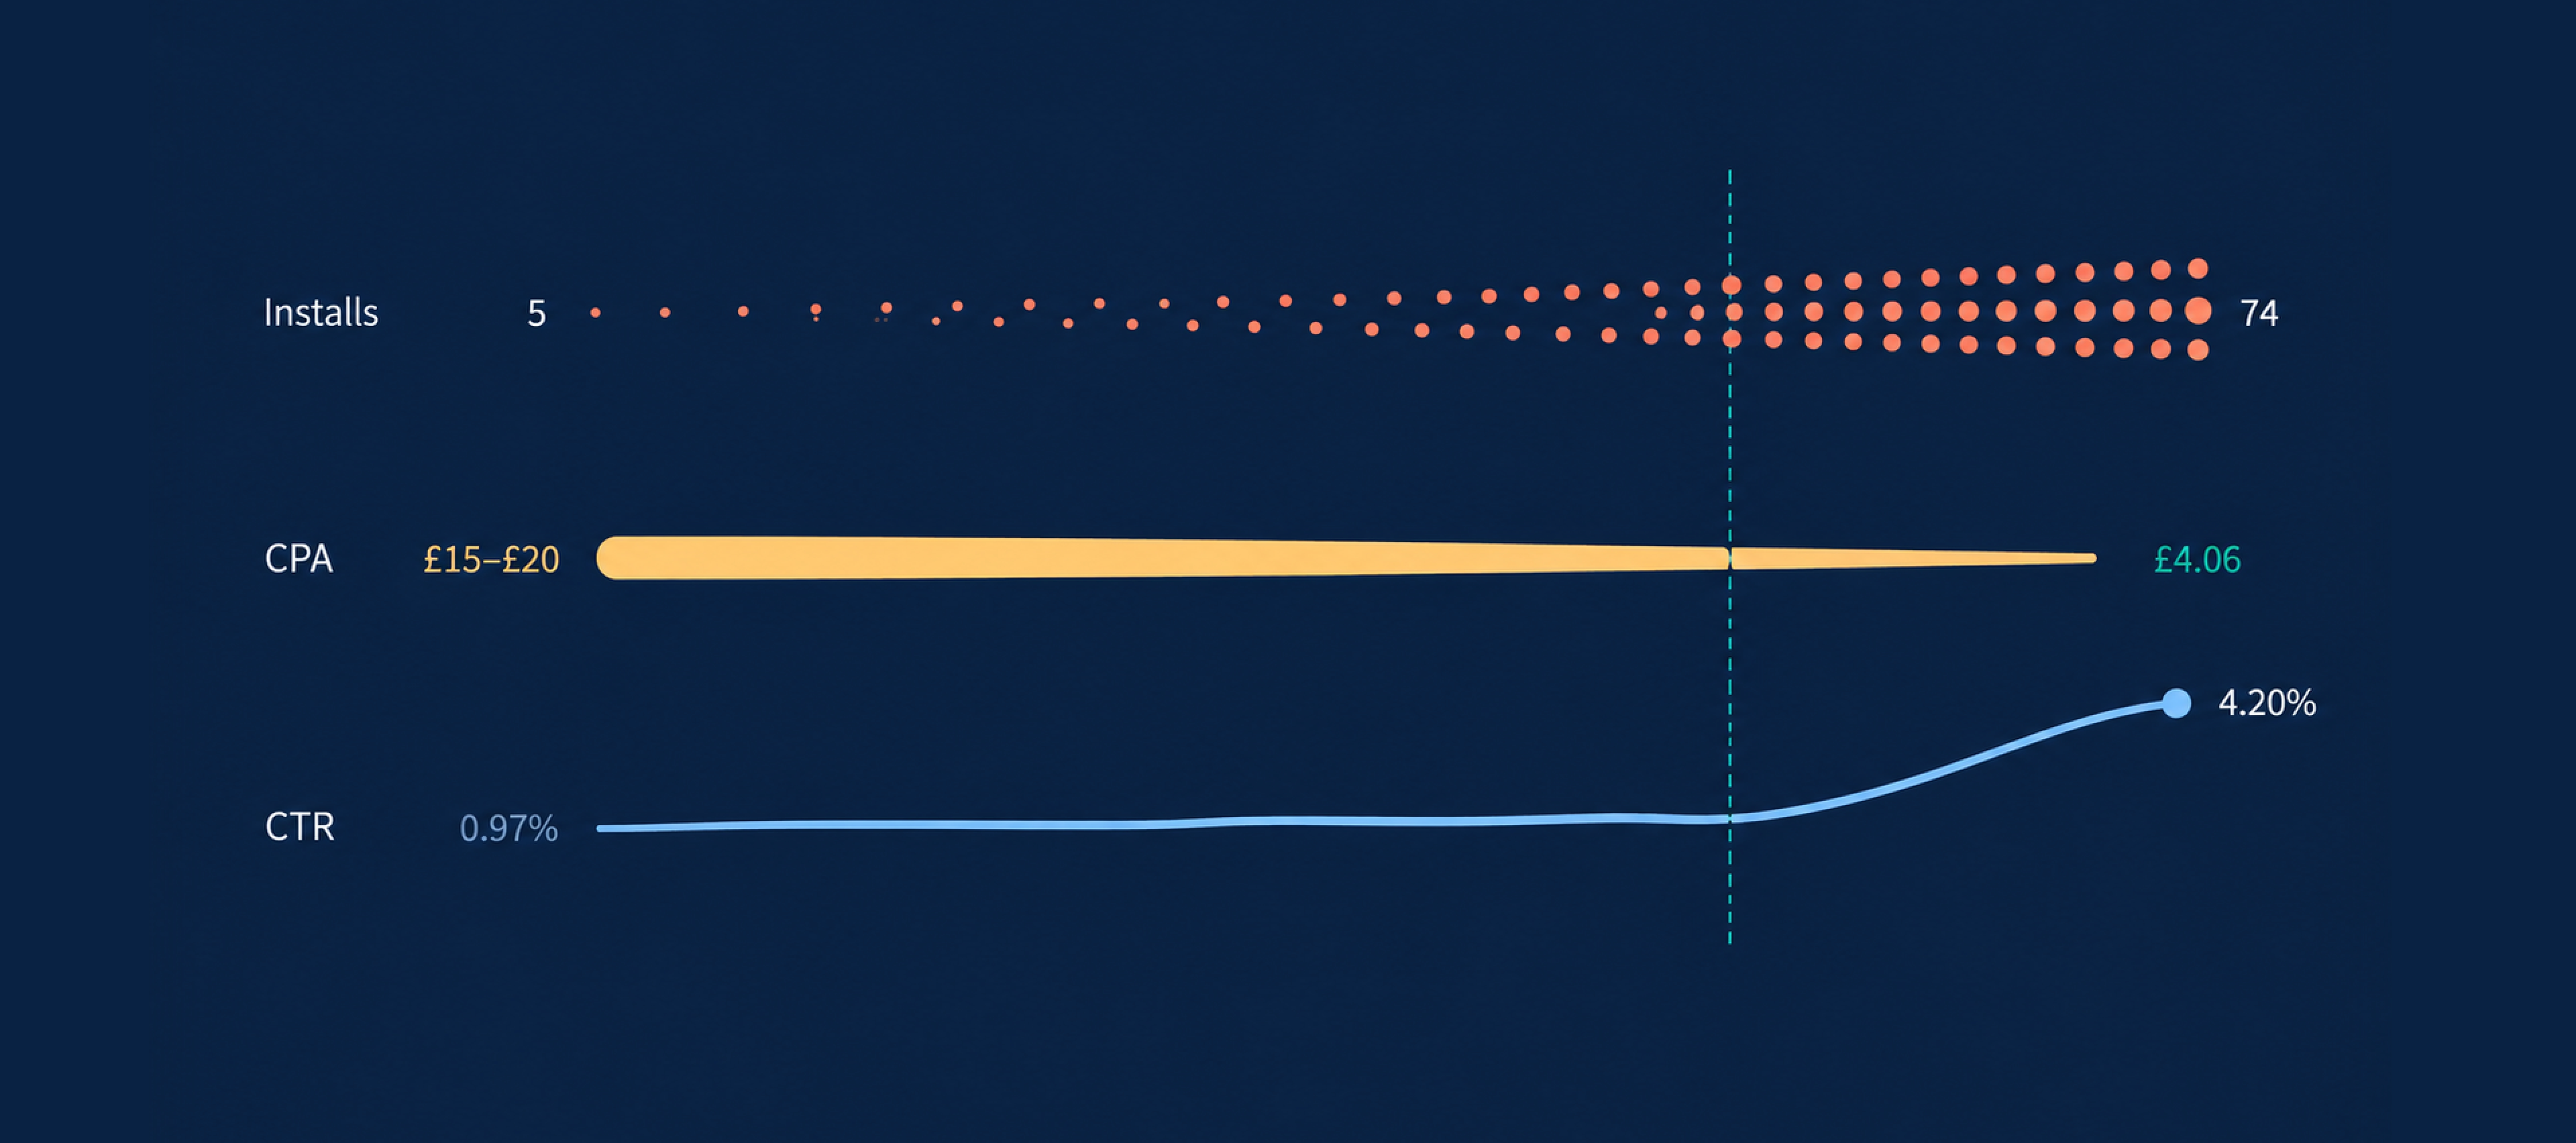
Spending more isn’t always the answer. In our experience, relevance — not budget — is what separates a campaign that scales from one that stalls. And this case of going from 5 to 74 weekly installs at a quarter of the original cost proves the point.
The campaign at a glance
Our client runs a women’s health period and cycle tracker on iOS, competing in one of the store’s most crowded categories. The budget was modest and fixed from the start, so outspending established players was never an option. The goal was to buy installs at a price the business could sustain, then keep pushing that price down.
Over the next seven months, the campaign achieved:
- Nearly 15x growth in weekly installs, from 5 to 74.
- Cost per install down from £15–£20 to £4.06.
- Click-through rate up from 0.97% to 4.20%.
This isn’t a story about outbidding anyone, but about buying cheaper installs through relevance, and we’re ready to show you how, step by step.
The situation at launch
When the campaign went live at the end of November 2025, the app was a finished product with no paid acquisition history at all. The starting position looked like this:
- A polished iOS app with strong ratings but almost no discovery.
- A health category dominated by well-funded, established competitors.
- A fixed monthly budget with no room for brute-force bidding.
- A product page built for organic browsing.
The main challenge was turning App Store searches into downloads. Paid placement and organic visibility address different parts of that journey: paid acquisition captures existing demand as it appears, while organic visibility helps build a steady stream of future discovery. We compare the two channels in more detail in SEO vs. SEM.
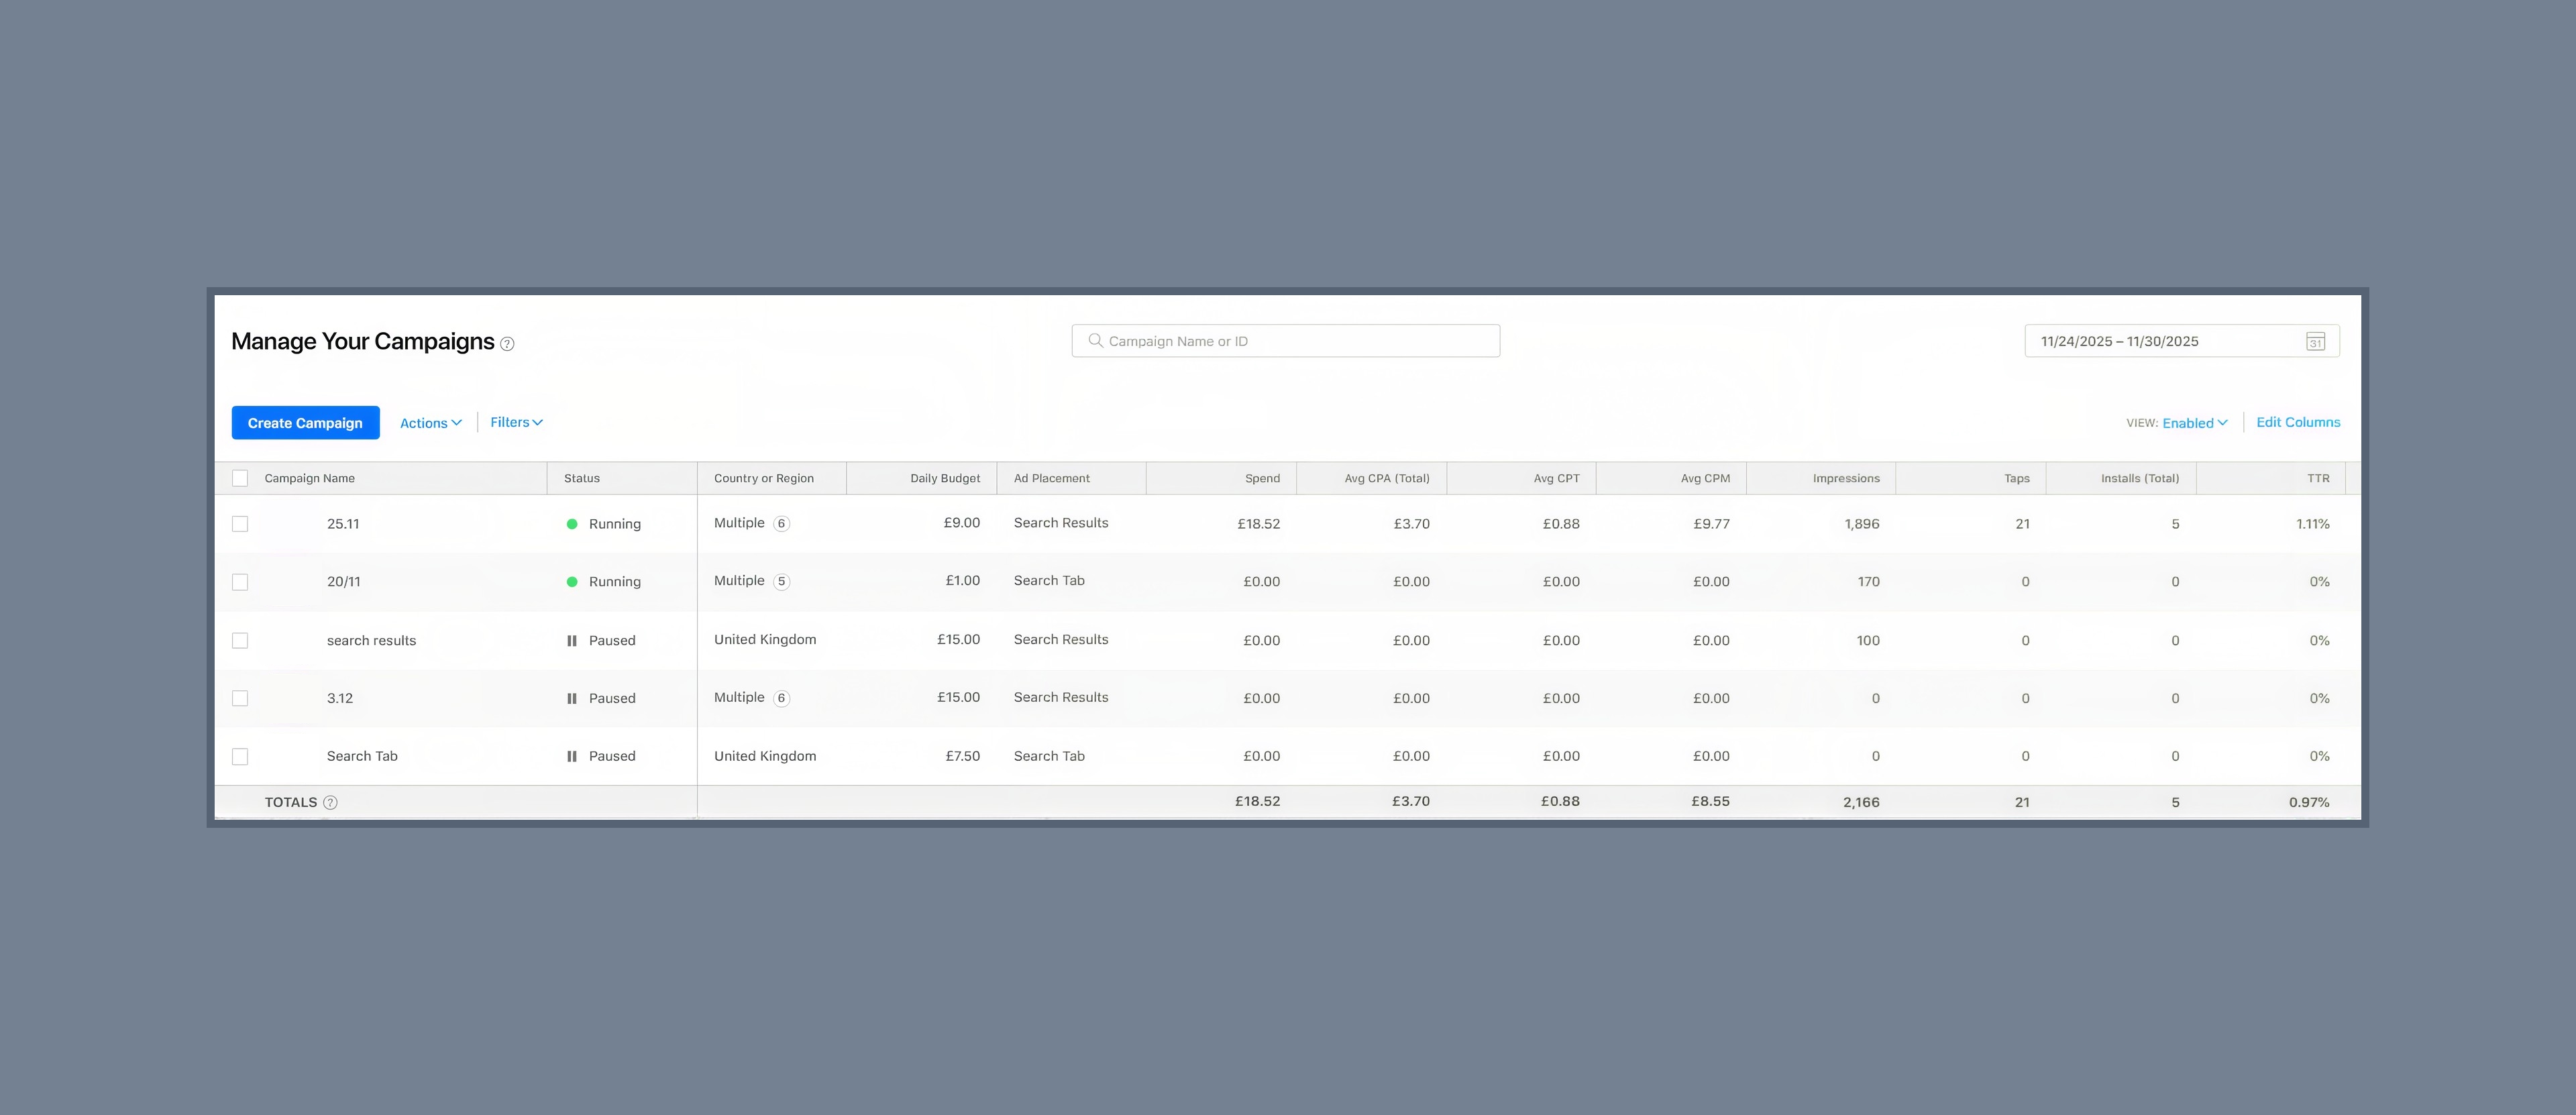
For a small-budget campaign, that distinction matters. Every irrelevant tap costs money without creating lasting value, leaving less budget to reach genuinely interested users. The first week showed just how difficult that conversion was: 2,166 impressions generated only 5 installs, with a 0.97% click-through rate.
Campaign goals
The client didn’t expect an overnight install “explosion.” As mentioned before, the goal was to prove that paid acquisition could work at this budget level before scaling anything. To get there, we set five objectives:
- Building a keyword set that matched real search intent.
- Covering every App Store placement rather than only search results.
- Bringing cost per install down to a sustainable level.
- Lifting conversion on the product page itself.
- Scaling volume without breaking the budget ceiling.
Strategy: how we built growth with limited budget
Working with a tight budget, we immediately ruled out the “launch broad, spend, then optimize” approach. There was no cushion to fund a discovery phase, so every week we had to pay for the next one.
The sequencing followed the same logic our team used to grow an e-commerce client’s organic channel from 5% of sales: fix the foundation first, earn relevance second, scale only what has already proven it converts. Here, that meant five stages, each narrowing what we paid for.
Stage 1. Launching everywhere to find where demand lived
Apple Search Ads Advanced offers four placement surfaces, each serving a different stage of the App Store journey. Search Results ads respond to an active search, while Search Tab ads show up before the user types anything. Today Tab ads appear on the App Store’s front page, and Product Page ads surface on the product pages of other apps, including “You Might Also Like.” We tested all four from day one.
The logic was simple: with a small budget, guessing which placement converts is more expensive than testing all of them briefly and cutting what doesn’t work. We wanted a baseline for each surface before deciding where to concentrate the budget.
To establish that baseline, we:
- Launched all four Apple Search Ads placements simultaneously.
- Kept Apple’s default “All Eligible Users” audience setting.
- Built themed ad groups separating generic terms from branded ones.
- Set manual maximum CPT bids inside Apple’s suggested ranges.
- Set daily budgets high enough to let each campaign spend without being cut off prematurely.
The first few weeks were modest, as expected. Impressions accumulated, installs stayed in single digits, and click-through rate hovered around 1%. At that stage, we were primarily gathering performance data across placements rather than optimizing aggressively. Cost per install ranged from £15 to £20.
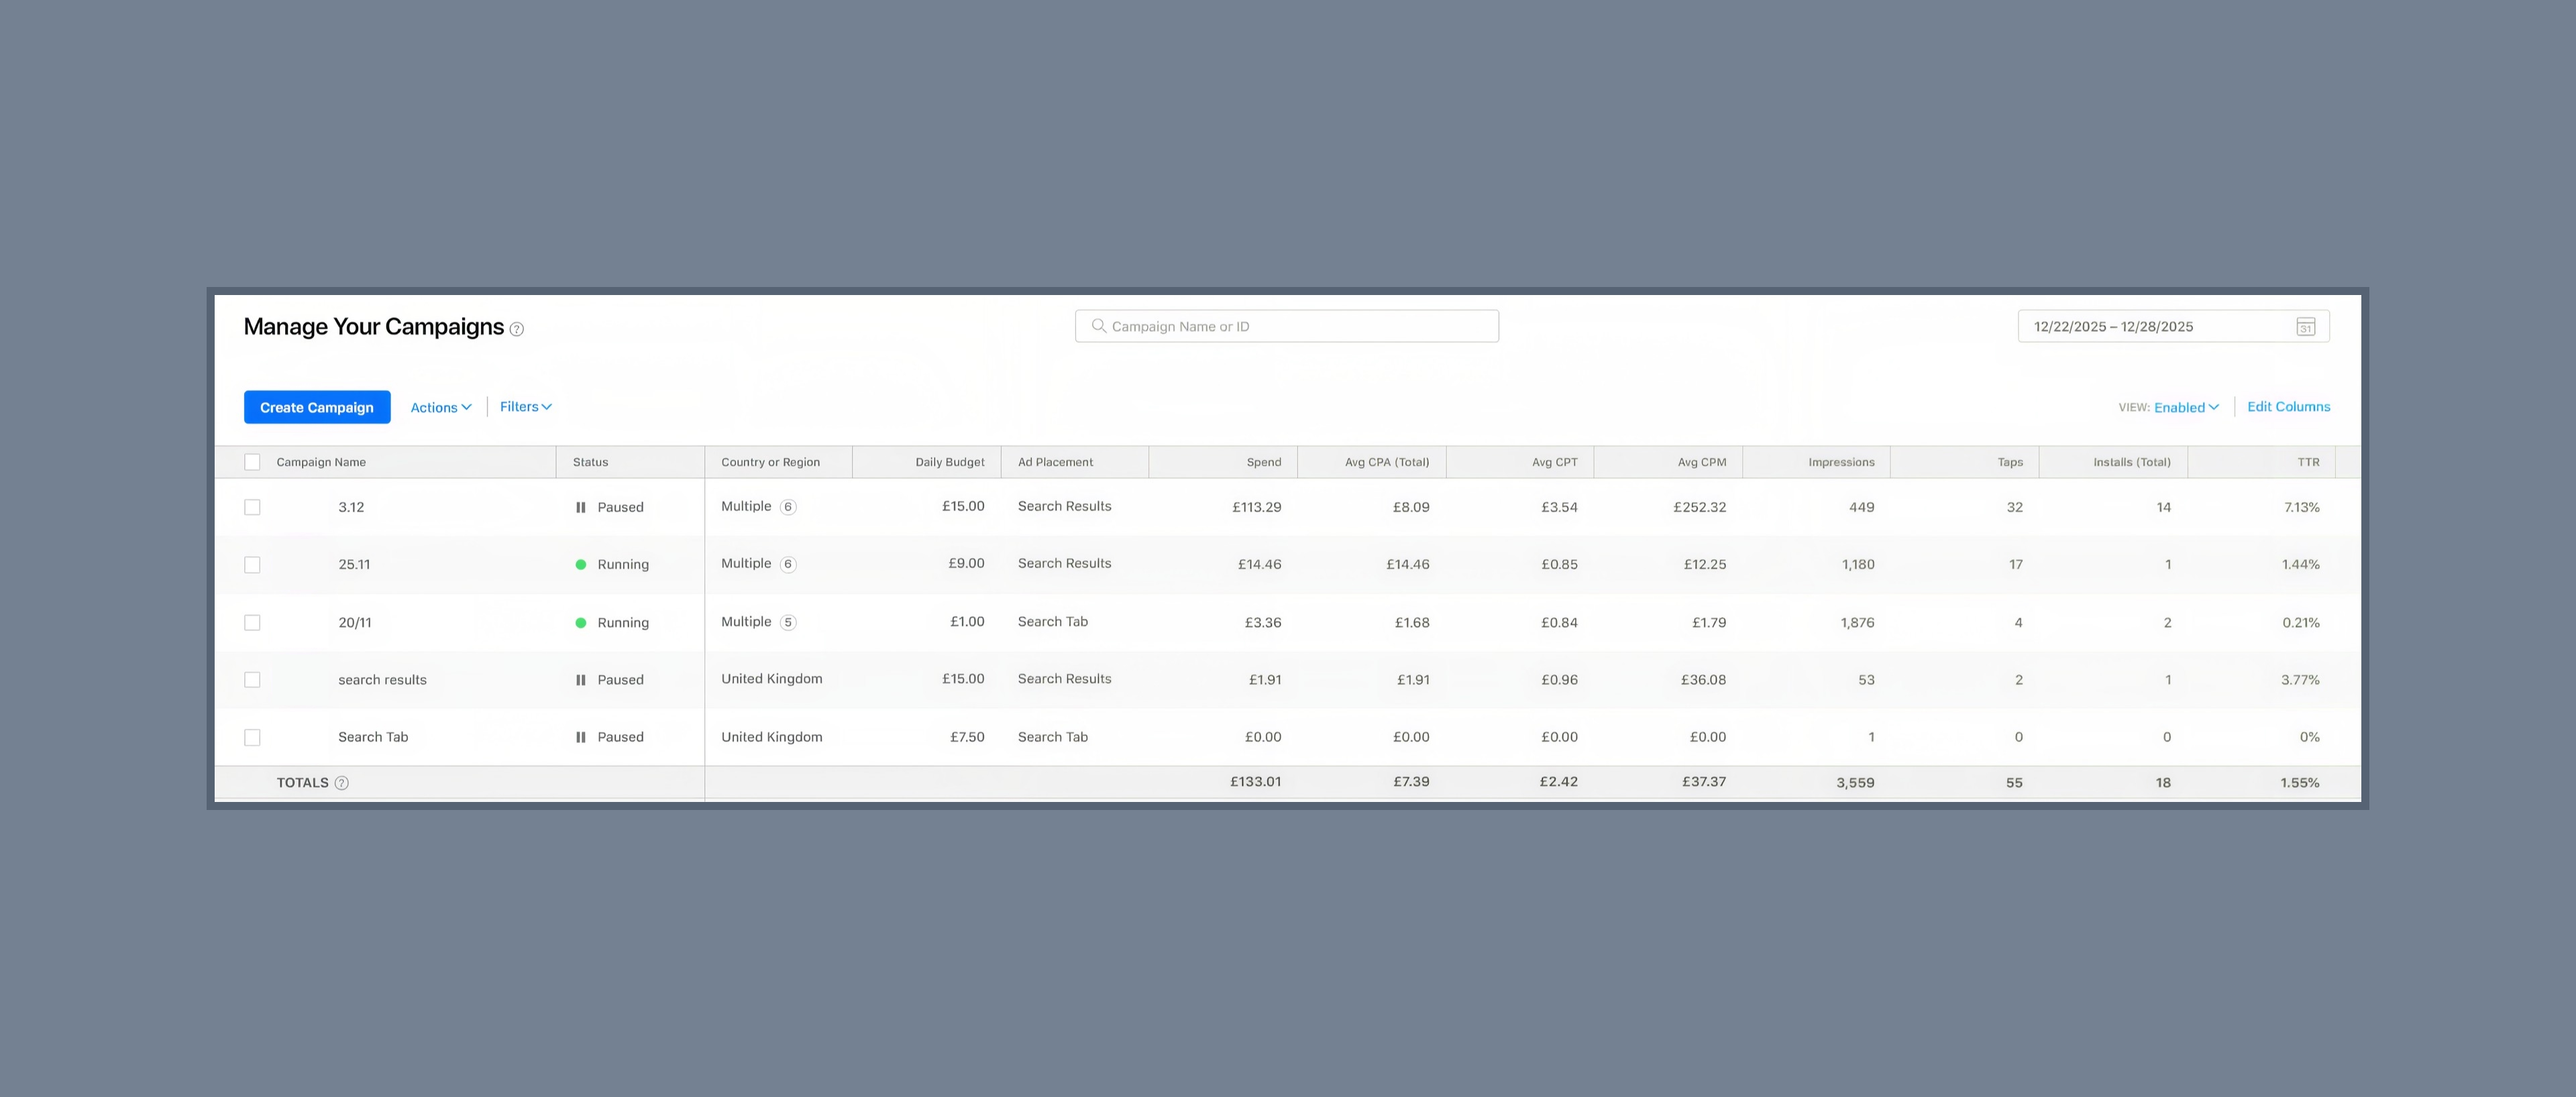
That was high, but we were buying data at that stage. By the week of 22–28 December, the picture had improved to 18 installs at a 1.55% click-through rate and £7.39 per install. Search results drove most of the volume, while browse placements delivered steady, cheaper impressions.
Stage 2. Keywords as a lever for relevance, not reach
January reversed the efficiency gains seen in December, but it taught us the most. Through December, we had expanded the keyword list aggressively, chasing long-tail terms and accepting most of what Apple’s recommendation tool suggested. It did look like progress because volume held. The pitfall was that relevance did not.
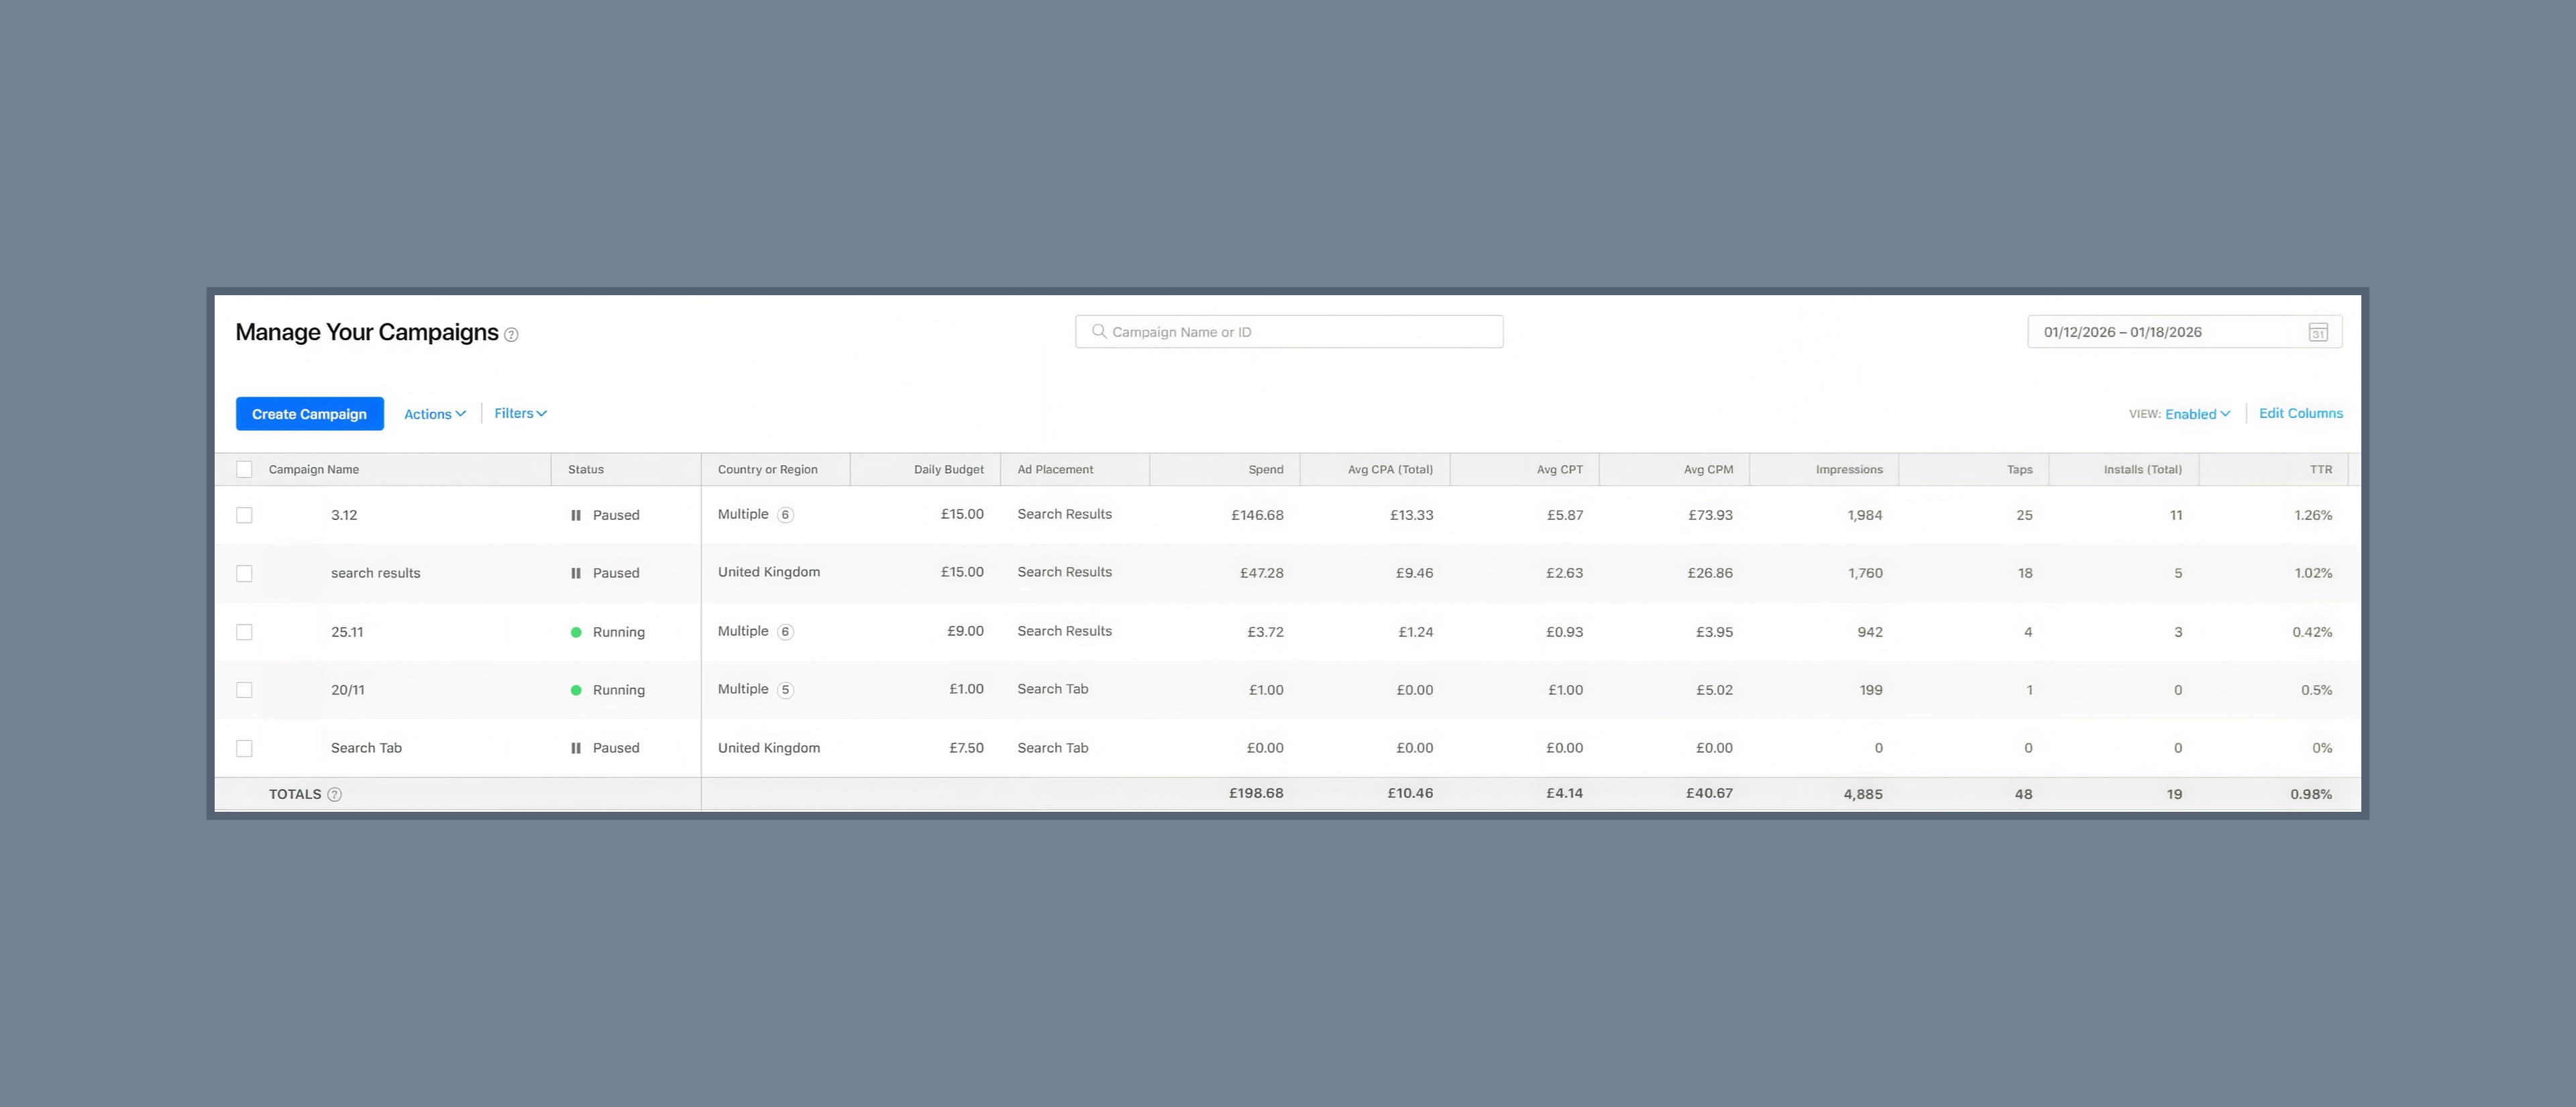
By the week of 12–18 January:
- installs had barely moved to 19;
- click-through rate had fallen to 0.98%;
- cost per install had climbed to £10.46.
In the end, we had bought reach, but paid for it in efficiency.
The extra reach was coming from a broader keyword set, but much of that traffic was not converting. At first glance, adding every recommended keyword looks like free volume. In practice, a broad list dilutes the average. Taps arrive from searches that were never going to convert, and blended cost per install rises even when the ads themselves haven’t changed. The fix was to add better keywords, not just more — the same discipline that makes keyword research the foundation of any acquisition channel.
Relevance is what makes a small budget behave like a large one.
At this stage, we needed to answer three questions:
- Which terms generated taps that actually converted into installs?
- Which terms drained the budget without converting?
- Where could negative keywords cut waste without cutting useful volume?
Rather than rebuilding the account, our team tightened it:
- Reviewed Apple’s keyword and bid recommendations daily.
- Tested new terms only where search popularity scored 4–5 out of 5.
- Added negative keywords wherever tap quality dropped.
- Paused or lowered bids on terms holding £17–£20 costs.
- Allowed a full week after each change before judging the result.
By early February, the search ad groups had settled at roughly 50–60 keywords in total — fewer than we had run in December, but considerably more efficient. Costs on the worst terms came down, and the account stopped leaking spend into searches that had never converted. What remained was a list where every term could justify its place.
Volume did not jump at this stage, and we didn’t expect it to. What changed was the quality of the traffic underneath the numbers. That gave us a much stronger base for scaling later.
The lesson here is simple: keyword expansion and keyword relevance pull in opposite directions, and on a limited budget, relevance wins. You should treat Apple’s recommendations as a source of candidates rather than a list of instructions. Test them one at a time, and measure the effect on blended cost instead of impressions. The same logic applies to organic search, as our guide to SEO keywords shows.
Stage 3. Bidding under a hard budget ceiling
For search results ads, Apple offers two ways to bid. Maximize Conversions (auto-bidding) hands bidding to Apple’s system, while manual cost-per-tap leaves it with you.
Automated bidding is the obvious choice for most advertisers, and on a larger budget we would likely have used it. However, auto-bidding needs conversion volume to learn, and at five to twenty installs a week, there simply wasn’t enough conversion signal for us to be confident it would improve efficiency. So we chose manual CPT, which let us control the maximum CPT we were willing to bid.
To keep spend predictable while the account was still small, we:
- Set manual max CPT bids anchored to Apple’s suggested ranges.
- Adjusted bids weekly against an internal cost-per-install target.
- Tracked impression share through Apple’s “Rank” metric.
- Raised bids only on terms already converting reliably.
- Kept campaigns live all day rather than front-loading spend.
Through the winter, spending stayed flat and predictable while efficiency improved underneath it. We set budgets high enough that campaigns wouldn’t pause midway through the day, preserving the opportunity to capture demand later rather than exhausting the budget too early. The bidding strategy had done its job: spend was controlled, and efficiency was stable.
But by late March, the account had plateaued. Installs sat at roughly 15–18 per week, while click-through rate hovered near 1%. We had a clean, well-targeted campaign that had stopped improving.
Stage 4. The product page as the real bottleneck
In our experience, a flat click-through rate alongside stable costs means the ads are fine, and something after the tap is not. So we stopped optimizing the campaign and looked at what users saw when they arrived.
Notably, every Apple Search Ads creative is assembled from App Store metadata — the icon, subtitle, and screenshots. The existing page had been written for someone browsing the store deliberately, with time to read. Ad traffic behaves differently, though. It arrives mid-task, from a specific query, and decides in seconds.
In late March we tested Creative Sets — alternate screenshot combinations that run inside a single ad group without requiring a separate campaign. The lift was marginal, which told us the problem wasn’t which screenshots we showed but what the screenshots said.
So on 2 April, our team shipped a full product page redesign that included:
- rewriting the page around the benefits users were seeking;
- replacing the screenshot set to lead with the core tracking value;
- aligning page messaging with the highest-converting keywords;
- verifying attribution in analytics before measuring the change;
- keeping the same page as the destination across all placements.
To read the effect cleanly, we didn’t scale anything that week. Spend for 2–8 April was held under £42, with only two campaigns live, so any change had to come from the page rather than from budget. On that reduced spend, the account still delivered 10 installs at £4.20 each — less than half the January cost — from just 58 taps. Click-through rate barely moved at 0.92%, which was the point: the ads were the same, and the traffic behind them was simply converting far better once it landed.
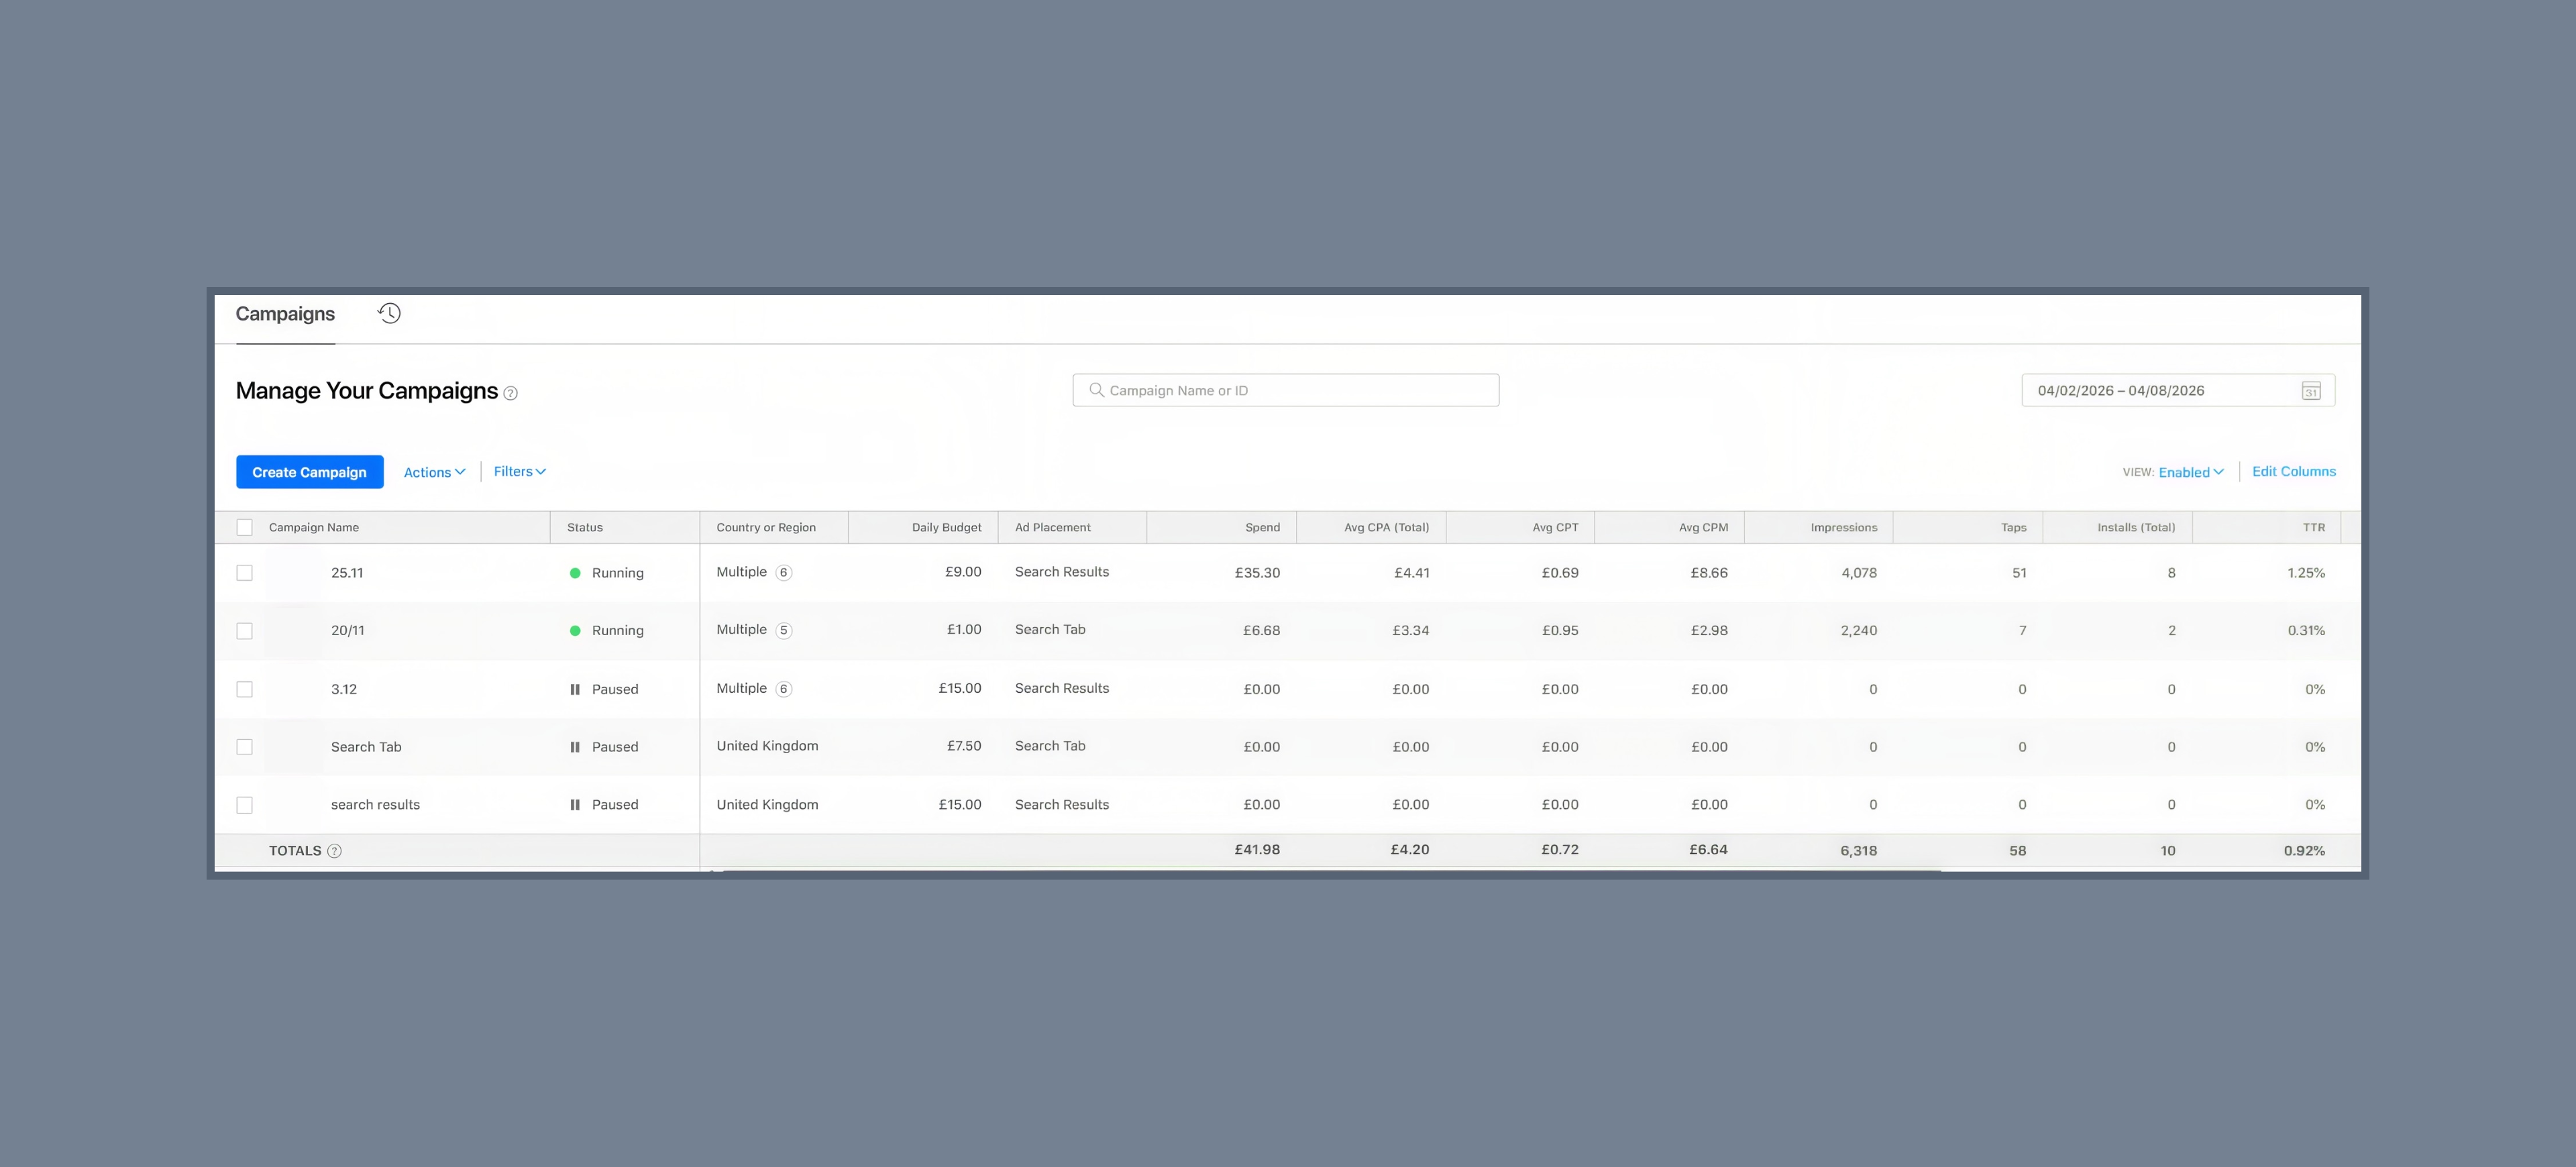
The following week held: 36 installs at a 1.42% click-through rate and £4.76 per install. Download rate after a tap climbed past 30%.
All in all, click-through rate and conversion rate fail for different reasons and need separate diagnoses. If taps are steady but installs aren’t, the campaign isn’t the problem and the product page is. Apple’s own guidance encourages testing icons, screenshots, and preview videos for exactly this reason. For a page-by-page approach to finding those leaks, see our SaaS website CRO audit.
Stage 5. Scaling once the unit economics held
By this point, we knew what worked. With CPA down by half, the job was no longer to find a viable formula but to put more budget behind it. The earlier keyword discipline meant there was little waste left to scale alongside the winners.
Through spring, we widened the funnel carefully:
- Revisited negatives to remove remaining low-quality traffic.
- Raised bids incrementally on consistently converting terms.
- Expanded daily budgets only where demand was going unserved.
- Kept the browse placements running for continuous visibility.
Following the negative keyword pass in mid-April, click-through rate moved above 2% for the week of 21–27 April. Through May it frequently exceeded 3%, while cost per install settled into a £4–£6 band.
Scaling multiplies whatever is already in the account, waste included.
By the week of 9–15 June, the campaign reached 74 installs from 4,812 impressions, a 4.20% click-through rate and £4.06 per install. Impressions had more than doubled since launch, while installs had grown nearly fifteenfold.
{{banner}}
Campaign results
Across roughly seven months, the campaign grew from an unproven experiment into a dependable acquisition channel. Weekly installs increased nearly 15x, from 5 to 74, while cost per install fell from £15–£20 to £4.06. At the same time, CTR rose from 0.97% to 4.20%, showing a substantial improvement in how effectively the ads captured relevant demand.
| Week | Weekly installs | CTR | Cost per install |
|---|---|---|---|
| 24–30 Nov 2025 | 5 | 0.97% | £~15-20 |
| 22–28 Dec 2025 | 18 | 1.55% | £7.39 |
| 12–18 Jan 2026 | 19 | 0.98% | £10.46 |
| 2–8 Apr 2026 | 10 | 0.92% | £4.20 |
| 9–15 Jun 2026 | 74 | 4.20% | £4.06 |
The results don’t appear to be driven by seasonality alone. January, typically a strong period for health and wellness demand, actually brought lower efficiency than December. The major improvements instead followed specific campaign changes, particularly the 2 April product page launch and mid-April negative keyword pass. We saw a similar pattern in a legal services CRO case, where fixing the page lifted conversions by 20% without a full redesign.
Three lessons from the campaign
Beyond the headline results, the campaign showed where small-budget acquisition tends to succeed or stall. Three takeaways are especially useful for teams facing the same constraints:
- Cut the keyword list before you scale it. Apple’s recommendation tool is a source of candidates, but on a limited budget, you must be critical. Blended cost per install tells you whether the list is working — not volume.
- Diagnose CTR and conversion rate separately. They fail for different reasons. If click-through rate is stable but installs aren’t growing, look beyond the campaign itself. In our case, the product page had become the bottleneck. Most advertisers optimize the ad long after the bottleneck has moved downstream.
- Don’t scale until the unit economics are clean. Scaling multiplies whatever is in the account — including waste. The right moment to raise budgets is when cost per install has held at a sustainable level for several consecutive weeks, not when impressions look promising.
Where the campaign goes next
In under seven months, the limit on growth stopped being the budget and became the size of the demand available to capture. That shift came from three changes: a keyword set cut back to what converted, a product page rebuilt for ad traffic, and bids held to a level the account could sustain. The account has now moved into a scaling and maintenance phase, with the focus shifting to product page testing, adjacent search terms, and potential expansion into new regions. The question is no longer whether the channel can work, but where the next layer of growth will come from.
{{banner-2}}